Summary findings from AEA/AFA 2024
Last weekend I attended the American Economic Association and American Finance Association 2024 annual meeting in San Antonio, TX. I love this event, as its jam packed with thought provoking research with a strict 20-minute presentation, 10-minute discussant structure (where the papers are respectfully criticized). There were roughly 6,000 economists and practitioners in attendance, and I wanted to share the most thought-provoking papers I saw presented that relate to my day job.
Michael Greenstone, AEA Distinguished Lecture, Air Pollution is the most serious issue facing humanity in terms of its ability to reduce the total number of lived years. The lecture had a number of helpful slides that describe the magnitude of the problem, American Economic Association: AEA Distinguished Lecture (aeaweb.org) (suggest watching at 2x speed); unfortunately, the effects of air pollution are not going to be felt equally around the world, air pollution is will disproportionately and negatively impact countries like India and regions in Africa that have the youngest and poorest populations.
Jeff Meli and Zornitsa Todorova, Portfolio Trading in the Corporate Bond Market, portfolio trading is a relatively recent innovation in the bond market. As we've all seen post 2008, bond liquidity has declined substantially, leading lots of hedge funds to bemoan the dangers of bond ETFs. Portfolio trading (PT) makes the fact that there are thousands of low liquidity CUSIPS less worrisome; and you can request pricing on a broad portfolio of CUSIPs rather than piece meal. T-costs for PT trading are about 6 bps vs 14 bps for RFQ. Also, time to execute for PT used to be 45 min to 1 hour, and now fixed income systematic investment firms have gotten PT pricing down to a few minutes. Prior to 2018, less than 1% of all corporate bonds were traded via portfolio trading, 99%+ were traded as request for quote (RFQ). By 2021 PT accounts for more than 7%. By trading large portfolios of bonds, you don't need to deal with matching problem on individual CUSIPs, but the ETF inflow linkage drives the benefits of low t-costs and also highlights PT's limitations. If ETF flows are all one sided (outflows) like in March 2020, internal data from Barclays shows that the t-costs benefit of PT vs RFQ went to zero.
Lily Fang et al, Limits to Diversification, the rise of passive investing limits the benefits of diversification. Correlated investor demand and trading generate excess correlation in asset prices relative to assets not included in index; in particular flows in and out of the index products (ETF/MF) leading to structurally higher correlation across stocks were analyzed using difference in difference. The degree to which passive funds hold a stock strongly predicts its beta and correlation with other stocks, pattern holds even when stripping out the 10 largest stocks. They also were able to rule out that the increased correlation could come from increased correlation of fundamentals, no evidence of it. Rise of passive investing isn't a free lunch, it means more correlation/less diversification benefits.
Michele Dathan and Caitlin Dannhauser, Passive Investors in the Primary Bond Market, I was surprised to learn that passive bond ETFs are increasingly active in the primary bond market even though primary bonds generally have not been included in those indices yet. Moreover, researchers presented evidence that passive funds allocation to primary issued bonds tend to underperform the primary bonds allocated to actively managed funds meaningfully. The researchers believe the reason for this is that both underwriters and fund families (GPs) are intentionally steering the better issues towards actively managed bond funds and the overpriced/higher risk issues towards their passive (low fee) products. Meaningful and consistent gross of fee outperformance detected for active bond funds in same fund families with respect to their primary bond market purchases.
Hao Jiang et all, The Rise of the Mega Firms and Passive Investing, probably the most controversial paper in terms of number of follow up questions by the systematic investment community over post-meeting coffees. Monthly flows into passive have been dramatic in the US over the last 10+ years. The standard view of index flows is that inflows to index funds are neutral with respect to underlying constituent pricing. They develop a theory which claims that passive reallocation is not neutral because idiosyncratic risk is priced differently for the largest firms in the index compared to the hundreds or thousands of smaller firms. They believe this has been a contributing factor to the rise of so called super-star firms, first called, FANG, then FANGM, then Mag 7, etc. Their theory makes four predictions, which they tested in the data; 1. passive flows raise the stock return vol of large firms while barely affecting that of smaller firms; 2. effect of passive flows are more pronounced for over-valued firms among the index's largest companies, this is because investors hold short positions in these firms stocks which get amplified when they cover, 3. flows have an asymmetric effect in the cross section driving the stock market up even when those flows are driven by investors switching from active to passive; 4. when individual firms are added to an index tracked by passive funds, the resulting stock price increase is larger for larger or overvalued firms. Over coffee, Hao told us that to the extent we believe the reallocation too passive to be fully played out, underweighting the top caps would be sensible, but to the extent you think the reallocation to passive continues as it has, overweighting the top mega caps should be sensible. Keeping in mind that the expected vol for the top mega caps should be much higher than the overall market.
Anthony Cookson et al, The Social Signal, using data from Twitter, StockTwits and Seeking Alpha, they find that after controlling for firm disclosures and news, attention is highly correlated across platforms but sentiment is not. Social media consumption has been growing over the years, with Americans spending 3.6 hours per day on SM. For investors social media has become a primary source to obtain information. The researchers wanted to know how similar both attention and sentiment were across platforms (as did many of the stat arb hedge funds in the audience). Attention was defined as volume of post, and sentiment was defined using several different NLP algos. Particularly interesting that sentiment had low commonality across platforms, but attention had high commonality. Sentiment predicts positive future returns (short term), and attention predicts negative future returns (short term). The data tables in this paper are fascinating.

Sophie Calder-Wang et al, Pricing Neighborhood Amenities, this paper developed a new econometric method to price amenities relevant in the real estate market, like air pollution. The problem with traditional econometric methods is that if you regress air pollution on home prices, you will find a positive coefficient on air pollution because more desirable places (large cities) tend to be more polluted, this is known as the wrong sign problem, even if you add per capita income to the regression as a control, you still get the wrong sign. The researchers develop a new method that compares cities using the PageRank algorithm but applied to the migration flow data, such that places where people are moving to get a higher rank, and places where people are moving to from already high ranked places get an even higher score. The researchers use this new variable as a control, and then are able to recover negative coefficients on air pollution. The top 20 Geographic Page ranked counties are as follows.
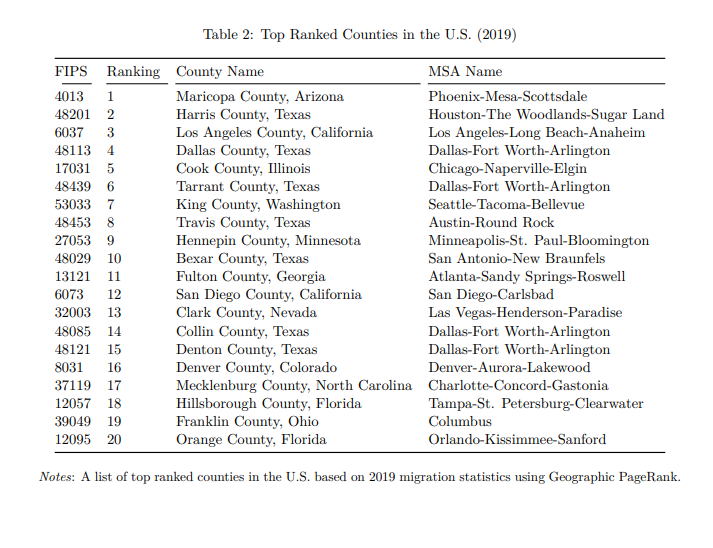
Bell, Calder-Wang, Zhong (2023); FWIW, I have been on real estate tours in Maricopa, Harris, Tarrant, and Dallas Counties and I can attest that for median-income people, the quality of life is very high. A 3 bed, 2br in a good school district can be purchased for less than $400k in all these locations, and rents are generally $1800-$2500.
Rongjie Zhang et al, Anti-Corruption Campaign and the Resurgence of SOEs in China, a lot of ink has been spilt on the performance of SOEs vs privately owned enterprises (POEs) in China over the last three years. A team of brave researchers at Tsinghua published a compelling paper that the anti-corruption campaign is casually related to SOEs dominance over the POEs over the last few years. The anti-corruption campaign that began in earnest in 2013, but really got going in 2015-2018 is historically unprecedented. The researchers believe that it is commonly understood that POEs give larger kickbacks than SOEs real estate developers do. In order to avoid being perceived as corrupt, the response among government officials has been to disproportionately favor selling land to SOEs and not POEs even if the project, terms, or proposal were worse in all respects relative to a similar offer from a POE. After the Anti-corruption campaign SOE's saw a 61% increase in land parcels purchased (roughly 406,000 sample size of land parcel data). Keeping in mind that the RE is China's largest sector, the implications of this paper are pretty far reaching and worrying. After anti-corruption campaign and big well publicized high level arrests, they see the share of SOE developers in residential land significantly increase. They see no effect in the control group, industrial land. Industrial land is far cheaper than residential. BC opinion, given the anticorruption campaign is core to President Xi's governance policy, we should not expect POE recovery, at scale, any time soon.
Darren Aiello et al, Who Invests in Crypto?, the authors obtain bank and credit card data on 63 million US consumers from January 2010 to June 2023, this data contains labeled transaction level data (i.e. $400 sent to Coinbase, $16 sent to Five Guys, $10 sent to McDonalds, etc.), on average they are observing about 9 million unique consumers per month. About 20% of adults in the sample own crypto and 50% own stocks. Crypto currency owners span all income levels, with the largest investments coming from wealthier individuals, similar to stocks. High past crypto returns and personal income positive shocks tend to lead to more crypto investment. Because they have transaction level data they can calculate individual level inflation measures, individuals with higher household-level inflation, do tend to investment more in crypto, suggesting that people are using crypto as an inflation hedge. For most US households, crypto investment behavior is similar to traditional investment behavior.